

Today, India tagged as the fastest growing economy in the whole world. The size of the economy has grown to 2.54 lakh crores which made it the 7th largest economy in the world. In this article, we have compared the changes in the different sectors of the economy of India from 2014 to 2017. In this article basically, we have compared three years of the current NDA government which resumed office in 2014 and performance of previous UPA government.
In this article, we have explained the changes in the different areas of the Indian economy. Let’s have a look.
1. Size of Economy

Image source: Forbes
2. Inflation Rate
Wholesale Price Index-WPI:
In 2013-14: 5.2% (Base Year -2004-05)
In 2016-17: 1.7% (Base Year -2011-12)
Consumer Price Index-CPI:
In 2013-14: 9.4% (Base Year – 2004-05)
In 2016-17: 4.5% (Base Year – 2011-12)
3. Expenditure on Education
A. The expenditure on education during the UPA government was Rs. 65,867 crore which has increased to Rs. 79,868 crore in the regime of NDA in 2017-18.
B. During the UPA government’s regime (2013-14), the total number of universities in the country was 723 which have increased to 799 in the NDA regime (2016-17). It means during the NDA regime, 76 new universities have been established.
C. In the time of UPA (2013-14), the total colleges in the country were 36,634 which have increased to 39071 during the NDA regime (2016-17) which means 2437 new colleges have been established.
D. In the time of UPA (2013-14), the total number of schools in the country was 1518160 which have increased to 1522346 during the reign of NDA. Thus, 4186 new schools have been added.
4. Tax Collection

Image Source: PIB
During the current NDA government’s tenure, the highest increase was in the income earned from excise duty. This income was Rs. 1.70 lakh crore in 2013-14 which increased by 139% during the tenure of the NDA government to Rs. 4.06 lakh crore. During the UPA government, the total tax collection in 2013-14 was 8.16 lakh crore which has increased to 12.27 lakh crores in the current government with an increase of 50%. Property tax has been abolished in the year 2016-17.
5. Expenditure on Health

source:www.hastakshep.com
In the year 2013-14, the UPA government used to spend only 1.2% of GDP on health which has been increased to 1.4% in 2016-17. The NDA government has made a provision of Rs. 48,878 crore for the health sector for the year 2017-18 which was Rs. 37,330 crore in the year 2013-14.
The current government has declared a new National Health Policy in 2017 under which it aims to increase the average age from 67.5 years to 70 years by 2025 with a target of 2.5% of GDP on healthcare.
6. Agriculture Production

Image source: Business Standard
In 2013-14, the production of food grains in the country was 2650 lakh tonne which is estimated to be around 273 lakh tonnes in 2016-17. Agriculture growth during the UPA regime was 4.01% which has increased to 4.83% in 2016-17. NDA government has targeted a loan of Rs 10 lakh crore to farmers this year, while farm loan of 7.11 lakh crore was distributed in UPA regime.
7. Employment Generation
In the financial year 2015-16, nearly 1.35 lakh jobs were created in the country, while it was 4.20 lakh during the UPA regime. However, in 2016-17, 2.13 lakh new jobs have been created in India in which key contributing sectors were service, manufacturing, and trade. At present, more than 30% of the youth aged between 15 to 30 years in the country are either unemployed or not taking training. So it can be concluded that the overall performance of the Modi government is not up to the mark in terms of the employment generation.
8. Housing for All
According to the 2011 Census, 27% of people in the cities live in the rented houses. Under the Prime Minister’s housing scheme, 18 lakh houses have been allowed to be built. While during the UPA regime, a total of 13.82 lakh houses were constructed in the tenure of 10 years. The present NDA government has allocated Rs. 15 lakh crore for 2016-17. It is worth to be mentioned that by 2022, India will need 30 million houses.
9. Industrial Development
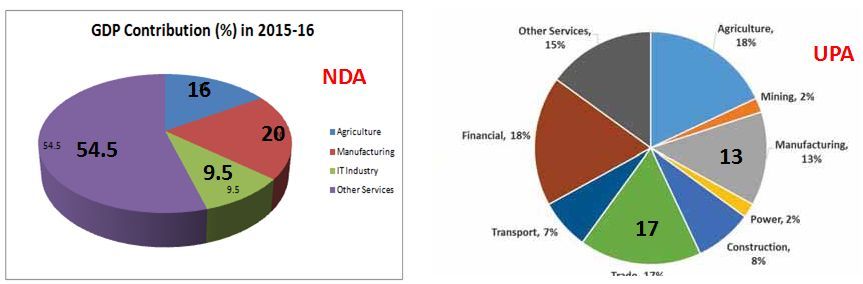
In the year 2013-14, the contribution of the industrial sector in the country’s GDP was 31.60% which is expected to fall to 31.12% in 2016-17. During the current NDA government, the industrial growth rate is 4.5% which is slightly better than the previous UPA government’s 4.2%. In the year 2013-14, 25.30 lakh cars were sold in India, while in the present government, the figure was 30.46 lakh in 2016-17.
10. Foreign Direct Investment
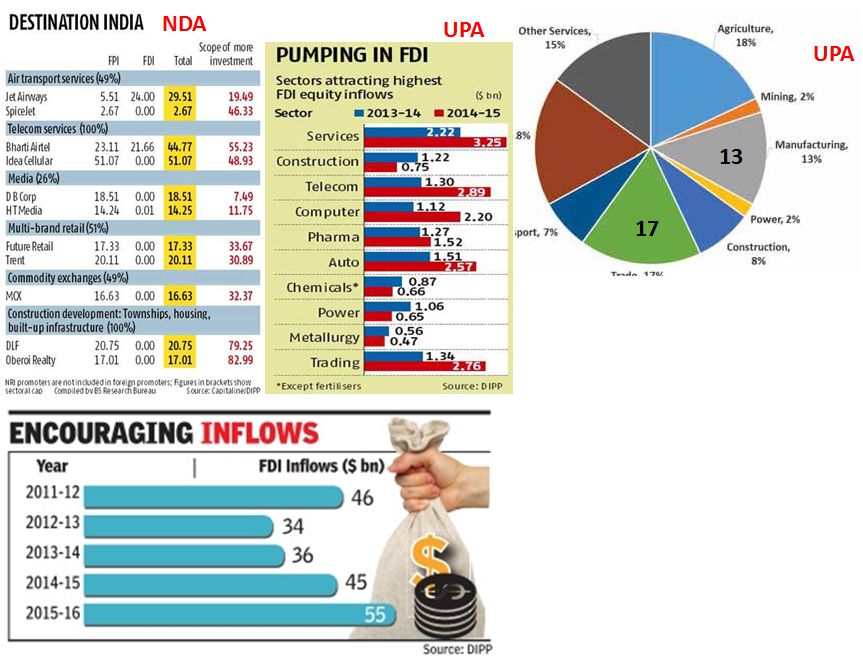
Image source: DIPP
In 2013-14, the inflow of Foreign Direct Investment in India was $36 billion which has increased to $55 billion in 2016-17. The Modi government has increased the FDI limit for cable and DTH services from 74% to 100%, whereas this limit has been increased from 26% to 49% for news channels and radio channels.
Now it can be concluded that the NDA Government performed better than the previous UPA government. That is why the economic prospects of the Indian economy look very encouraging except employment generating activities.
India has a very bright future ahead because currently, 55% of the Indian population is below the 25 years which made it the youngest economy in the world. That is the reason that the whole world is looking towards India for getting its young talent.